Hypokalemia on the Electrocardiogram
Hypokalemia is one of the most common electrolyte disorders in clinical practice. It is defined as potassium level in the plasma below 3.5 mmol/L (3.5 mEq/L) 1 2.
Hypokalemia causes electrocardiogram (EKG) change, especially during the ventricular repolarization; it may also pormote the appearance of supraventricular and ventricular arrhythmias 2.
Unlike hyperkalemia, EKG findings associated with hypokalemia are not a determining criterion of severity. However, an electrocardiogram must be done in all patients who are diagnosed with Hypokalemia 2
Clinical Presentation of Hypokalemia
Serum Potassium
Only 2% of the total body potassium is in the extracellular space, the remaining 98% is contained in the cells (intracellular space) 1 5.
Four mechanisms may cause hypokalemia: Decreased potassium intake, a shift from the extracellular to the intracellular space, increased extrarenal losses and increased urinary losses 3.
Pathophysiology of Hypokalemia
Inadequate potassium intake: potassium intake is normally 40 to 120 meq per day, most of which is then excreted in the urine. Thus, decreased intake alone rarely causes significant hypokalemia 3.
Extracellular/intracellular shift: it may be secondary to metabolic alkalosis, therapy with insulin, beta-2 adrenergic agonists (salbutamol) or other drugs 3.
Increased extrarenal losses: the most frequent causes of extrarenal losses are gastrointestinal losses (diarrhea, use of laxatives, fistulas); although extensive burns and profuse sweating may also cause hypokalemia.
Increased urinary losses: the most common causes of hypokalemia due to urinary potassium losses include diuretic use, a primary increase in mineralocorticoid activity and increased distal delivery of nonreabsorbable anions 3.
Hypokalemia Definitions:
Normal serum potassium levels are between 3.5 mmol/L (3.5 mEq/L) and 5.0 mmol/L (5 mEq/L). Levels below 3.5 mmol/L (3.5 mEq/L) indicate hypokalemia.
- Mild hypokalemia: serum potassium between 3.0 mmol/L (3 mEq/L) and 3.5 mmol/L (3.5 mEq/L).
- Moderate hypokalemia: serum potassium between 2.5 mmol/L (2.5 mEq/L) and 3.0 mmol/L (3 mEq/L).
- Severe hypokalemia: serum potassium <2.5 mmol/L (2.5 mEq/L).
Clinical picture of Hypokalemia
Symptoms associated with hypokalemia are correlated not only with serum potassium levels, but also with the rate of increase in potassium concentration.
Low serum potassium levels provoke cell membrane hyperpolarization, which causes the clinical manifestations 4.
Mild hypokalemia rarely causes symptoms. Serum potassium <3 mmol/L (3 mEq/L) generally causes muscle weakness, myalgia, paresthesias, vomiting or digestive disorders.
With serum potassium levels below 2.5 mmol/L (2.5 mEq/L) muscle weakness and parestesias progress to lower limbs, trunk and upper limbs. Rarely, in very severe cases, it may lead to paralysis and respiratory failure. Rhabdomyolysis is also common in severe hypokalemia.
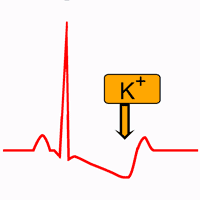
On the EKG, it causes disturbances on ST-segment, T wave and U wave. Hypokalemia also promotes the appearance of supraventricular and ventricular ectopic arrhythmias 2.
Hypokalemia on the EKG
An electrocardiogram should be done in all patients with Hypokalemia.
Alterations on ST-segment, T wave and U wave are the main EKG changes of hypokalemia.
EKG changes vary depending on the severity of the hypokalemia, however there is no a direct correlation with serum potassium levels. Mild hypokalemia (between 3.0 mmol/L and 3.5 mmol/L) rarely causes significant changes on the electrocardiogram.
Serum potassium levels below 3 mmol/L causes progressive depression of the ST-segment, a decrease in T wave amplitude, and an increase in U wave amplitude 2.
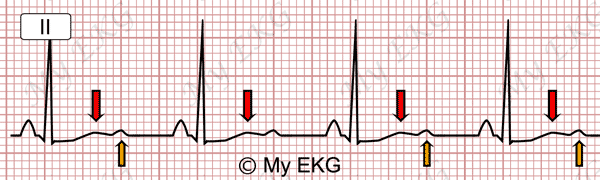
Moderate hypokalemia:
ST-segment depression, T waves flattening (red arrows), prominent U waves (orange arrows).
With severe hypokalemia these alterations are more pronounced, there is greater ST-segment depression, the T wave becomes negative and the U wave becomes higher.
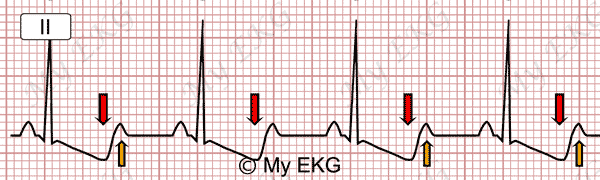
Severe hypokalemia:
ST-segment depression, negative T waves (red arrows), prominent U waves (orange arrows).
T wave and ST segment changes may mimic a non-ST-elevation acute coronary syndromes as well as digitalis toxicity.
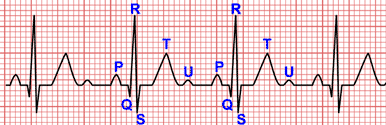
QT Interval Prolongation on Hypokalemia
Patiens with low potassium levels may be misdiagnosed of long QT syndrome due to the T wave and U waves may be fused, simulating a single wave (T wave with low amplitude and prominent U wave), measuring QT interval from the beginning of the QRS complex to the end of the U wave.
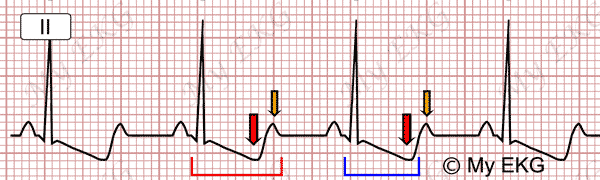
QT interval on hypokalemia:
Marked in red, inclusion of the U wave on the QT interval. Marked in blue, real QT interval. Red QTc 525 ms (long), blue QTc 436 ms (normal).
It is important to know this error during the reading of the electrocardiogram. One method to prevent this error is to measure the QT interval on lead aVL where U wave is often less prominent.
Arrhythmias Associated with Hypokalemia
Hypokalemia promotes the appearance of supraventricular and ventricular ectopic complexes, atrial tachycardias and different degrees of AV blocks 2.
Arrhythmias appearing in patients with severe hypokalemia are of the same type as in patients with digitalis toxicity; these arrhythmias are attributed to a combination of increased automaticity of ectopic pacemakers and at least some degree of AV conduction disturbance. Similar to digitalis, hypokalemia increases sensitivity to vagal stimulation 2.
In patients with severe hypokalemia, ventricular tachycardia, torsades de pointes, and ventricular fibrillation, have been reported in the absence of heart disease or digitalis therapy 2.
The presence of underlying heart disease or digitalis therapy increases the risk of severe arrhythmias.
Treatment for Hypokalemia
The urgency of therapy depends upon the severity of hypokalemia, associated and/or comorbid conditions, and the rate of decline in serum potassium concentration 6.
Oral potassium chloride is preferred in patients with mild or moderate hypokalemia because the correction of serum potassium concentration is generally faster with potassium chloride than with other salts 6 7.
When hypokalemia is severe or occurs in patients patients who are unable to take oral medicine, potassium chloride can be given intravenously 6 7.
In general, potassium chloride replacement rates should not exceed 20 mEq/hour and cardiac monitoring is recommended at such high rates. Close monitoring of the serum potassium concentration and EKG are crucial to reduce the risk of inadvertent hyperkalemia during replacement therapy 7.
Summary
Unlike hyperkalemia, EKG findings associated with hypokalemia are not a determining criterion of severity; however, an electrocardiogram must be done in all patients who are diagnosed with hypokalemia.
Alterations on ST-segment, T wave and U wave are the main EKG changes of hypokalemia; however, there is no a direct correlation between EKG changes and serum potassium levels.
Hypokalemia promotes the appearance of atrial arrhythmias, different degrees of AV blocks and, in patients with severe hypokalemia, potentially life-threatening ventricular arrhythmias.
We hope this article help you to identify hypokalemia on the electrocardiogram.
References
- 1. Taal MW, Chertow GM, et al. Brenner and Rector's The Kidney. 9th ed. Philadelphia: Elservier Saunder; 2011.
- 2. Surawicz B, Knilans TK. Chou’s electrocardiography in clinical practice, 6th ed. Philadelphia: Elservier; 2008.
- 3. Hall J E. Guyton & Hall. Tratado de fisiología médica. 12a ed. Barcelona: Elsevier; 2011.
- 4. Mount DB. Causes of hypokalemia in adults. [Internet]. UptoDate 2016 [cited: September 18 2017].
- 5. Mount DB. Clinical manifestations and treatment of hypokalemia in adults. UptoDate 2016 [cited: September 18 2017].
- 6. Asmar A, Mohandas R, Wingo CS. A Physiologic-Based Approach to the Treatment of a Patient With Hypokalemia. Am J Kidney Dis. 2012 Sep; 60(3): 492–497. doi: 10.1053/j.ajkd.2012.01.031.
If you Like it... Share it.