How to Read an Electrocardiogram
The first step is to make sure the electrocardiogram is correctly performed.
Determine if the paper speed and amplitude values are normal. In a standard EKG, the speed is 25 mm/s and the amplitude 1 mV by 10 mm (read EKG paper).
For that, we must check the speed at which the paper moves and the amplitude values–on a standard EKG, speed is 25 mm per second and the amplitude value, 1 mV per 10 mm (read EKG paper).
Check that all 12 leads are correctly recorded and that the EKG does not have too many artifacts that make reading difficult.
If the reading is difficult or the electrocardiogram has errors, it should be repeated if possible.
Assuming the electrocardiogram is correctly performed, we start our reading, always following the same sequence so we do not miss anything:
- Heart rate
- Heart rhythm analysis
- PR interval
- QT interval
- Heart axis
- ST segment abnormalities
- Abnormal waves and intervals
Sequence to Read an EKG
Heart Rate
The first step is to determine the heart rate. We must at least know if we are dealing with a tachycardia, a bradycardia or a normal heart rate. This will allow us to move on to the next step.
In the article how to calculate the heart rate we explain how to calculate it, and even provide you with a heart rate calculator to make your job easier.
Heart Rhythm
The next step is to determine if the QRS complexes are rhythmic. How to know, simple, observe if the R-R intervals (distance between two QRS) are similar. If in doubt, make sure by using a compass or a ruler.
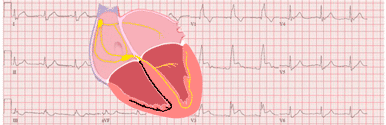
Then you must determine whether the electrocardiogram is in sinus rhythm. To do this, you must determine whether each cardiac cycle has a P wave generated by the sinus node always followed by a QRS complex (read sinus rhythm).
If these conditions are met, we can say that the electrocardiogram is rhythmic and it has a sinus rhythm (read heart rhythm analysis).
PR Interval
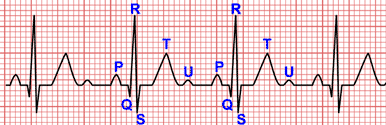
The PR interval (normal between 0.12 s and 0.20 s) should be measured from the beginning of the P wave to the beginning of the QRS complex.
A prolongation of the PR interval allows the diagnosis of a first degree AV block. A short PR interval allows the diagnosis of Wolff-Parkinson-White syndrome (read PR interval).
QT Interval
The QT interval should be measured from the beginning of the QRS complex to the end of the T wave.
The QT interval varies depending on the heart rate, so its value should be corrected according to the heart rate. The corrected QT interval or QTc is normal between 350 ms and 440 ms (read QT interval).
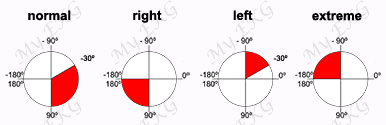
Heart Axis
It is one of the most hardest steps in EKG analysis. A safe and quick method to know if it is normal is to determine if the QRS complex of leads I and aVF is positive (read how to calculate heart axis).
ST-Segment Abnormalities
Now it's time to look at the ST-segment. That dreaded line that warns us of the presence of ischemic heart disease.
The ST-segment is the line between the end of the QRS complex and the beginning of the T wave. It must be isoelectric, to be sure if it has a depression or an elevation it must be compared with the PR segment or, in case of doubt, with the TP segment (between the T wave of the previous beat and the P wave of the analyzed beat) (read ST segment abnormalities).
Check all Waves and Intervals:
To finish the analysis, each waves and intervals of the electrocardiogram that we have not previously evaluated must be assessed.
For example, evaluate the presence of a bundle branch block, alterations of the P wave, pathological Q waves, or alterations of the T wave (read abnormal waves and intervals).