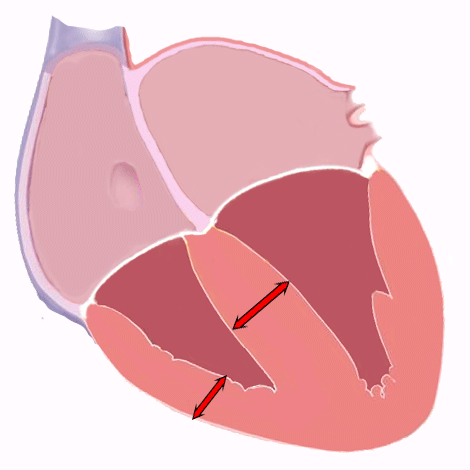
Right ventricular hypertrophy (RVH) is the thickening of the right ventricular wall due to chronic pressure overload.
RVH may be caused by different conditions which increase right ventricle afterload, and it is associated with significant morbidity and mortality 1.
There are recommended electrocardiographic criteria for RVH 2 3, which could provide a non-invasive, well-tolerated and inexpensive method of screening, but this criteria have unclear accuracy in a patients without known cardiovascular disease 1.
Electrocardiogram of Right Ventricular Hypertrophy
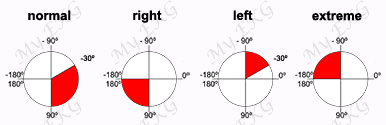
Right ventricular hypertrophy causes a displacement of the QRS vector toward the right and anteriorly and often causes a delay in the R wave peak in right precordial leads 3.
However, considerable degrees of RVH are often required to change the balance of right and left ventricular vectors, because the vector of left ventricular activation dominates the balance in the normal heart and even more so in the setting of left ventricular hypertrophy. Thus, the ability of the EKG to detect RVH may be expected to be low 3.
Electrocardiographic RVH, particularly in congenital heart disease, has often been classified on the basis of two EKG patterns 2 3.
One pattern consists of predominantly tall R waves (Rs, R, or Qr pattern) in right precordial leads (typical RVH pattern 2), suggesting pressure overload. Second pattern consists of incomplete right bundle branch block, suggesting volume overload 3.
Typical Right Ventricular Hypertrophy Pattern
The typical RVH pattern is a mirror image of the left ventricular hypertrophy pattern.
Electrocardiographic manifestations includes right axis deviation, tall R waves in the right precordial leads (V1-V2), deep S waves in the left precordial leads (V5- V6), and a slight increase in QRS complex duration 2.
This pattern is characteristically present in patients with congenital pulmonary stenosis and tetralogy of Fallot, but also in patients with primary pulmonary hypertension, and other conditions in which the right ventricular mass tends to approach or exceed the left ventricular mass 2.
Incomplete Right Bundle Branch Block
Incomplete right bundle branch block, manifested by the rSR’ pattern in the right precordial leads, is attributed to delayed activation of the hypertrophied right ventricular outflow tract 2.
This pattern is most frequently due to factors other than RVH.
It can signify hypertrophy, dilation, or overload of the right ventricle, perhaps most commonly in mitral valve disease with pulmonary hypertension and atrial septal defect.
In patients with pulmonic valvular stenosis, the R’ voltage correlates with the severity of stenosis 2.
Both patterns are associated with right-axis deviation.
Both are also frequently associated with ST depression and T wave inversion in right precordial leads; as with left ventricular hypertrophy, these ST-T abnormalities are better referred to as “secondary ST-T abnormality” than as “strain” 3.

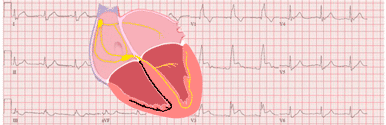
Right Ventricular Hypertrophy:
Incomplete right bundle branch block, right-axis deviation (117º), ST depression and T wave inversion in leads V1 to V5, P pulmonale.
Right-axis deviation and prominent anterior forces in the right precordial leads should be required for the electrocardiographic diagnosis of RVH in nearly all cases.
On the other hand, such features occur for various reasons other than RVH, including a not-infrequent normal variant 3.
Right Ventricular Hypertrophy EKG in Chronic obstructive pulmonary disease
Chronic obstructive pulmonary disease often causes a characteristic EKG pattern that reflects mainly the low diaphragm resulting from the increased lung volume.
This pattern includes low voltage in the limb leads; a frontal plane QRS axis that is rightward, superior, or indeterminate; a rightward P wave axis (ie, greater than 60 degrees); persistent S waves in all precordial leads; and low R wave amplitude in V6.
Right ventricular hypertrophy is suggested, in the presence of the chronic obstructive pulmonary disease pattern, only if R wave amplitude in V1 is relatively increased 3.
Right Ventricular Preponderance in Newborn Infants
Newborn infants have right ventricular preponderance with prominent R waves in the right precordial leads and deep S waves in the left lateral precordial leads (read pediatric EKG).
Therefore when an EKG is interpreted as showing right ventricular hypertrophy in this age group, the message to be conveyed is that the hypertrophy pattern is abnormal in comparison to that in normal patients of the same age 3.
Criteria for Right Ventricular Hypertrophy
Although the sensitivity of the electrocardiographic criteria for right ventricular hypertrophy is generally low, some criteria have high specificity and can be used to advantage in diagnostic schemes or to derive continuous variables.
The greatest accuracy is in congenital heart disease, with intermediate accuracy in acquired heart disease and primary pulmonary hypertension in adults. The lowest accuracy occurs in chronic lung disease 3.
Numerous criteria mostly derived from the amplitude of R and S waves in leads I, V1, V6, and the R wave peak time in V1 have been proposed.
RVH EKG Criteria |
| Tall R in V1 | >6 mm |
| Increased R:S ratio in V1 | >1.0 |
| Deep S in V5 | >10 mm |
| Deep S in V6 | >3 mm |
| Tall R in aVR | >4 mm |
| Small S in V1 | <2 mm |
| Small R in V5 and V6 | <3 mm |
| Reduced R:S ratio in V5 | <0.75 |
| Reduced R:S ratio in V6 | <0.4 |
| Reduced R:S V5 to R:S in V1 | <0.04 |
| (R 1 + S III) – (S I + R III) | <15 mm |
| Max R V1,2+ max S I, aVL–S V1 | >6 mm |
| R in V1 + S in V5,6 | >10.5 mm |
| R peak in V1 (QRS duration <0.12 sec) | >0.035 sec |
| QR in V1 | Present |
| Supporting Criteria |
| RSR in V1 (QRS duration >0.12 sec) | Present |
| S >R in I, II, III | Present |
| S in I and Q in III | Present |
| R:S V1 >R:S V3,4 | Present |
| Negative T wave V1 through V3 | Present |
| P II amplitude | >2.5 mm |
From de Hancock EW, Deal BJ et al. AHA/ACCF/HRS Recommendations for the Standardization and Interpretation of the Electrocardiogram. Part V: Electrocardiogram Changes Associated With Cardiac Chamber Hypertrophy. Circulation. 2009;119:e251-e261. doi: https://doi.org/10.1161/CIRCULATIONAHA.108.191097 3.