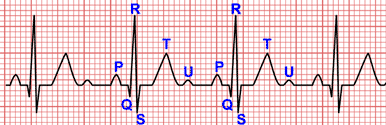
Intervals and Segments of the Electrocardiogram
Before we start, let’s clarify the concepts of electrocardiographic interval and segment. They appear to be the same thing, but they are not.
Electrocardiographic segment: line (usually isoelectric) that connects two waves without including either one of them.
Electrocardiographic interval: portion of the EKG that includes a segment and one or more waves.
Difference Between Segments and Intervals
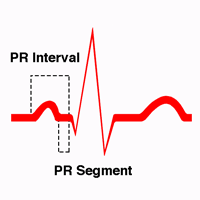
PR segment: line that connects the end of the P wave with the beginning of the QRS complex.
PR interval: from the beginning of the P wave until the beginning of the QRS complex — that is, including the P wave.
R-R Interval
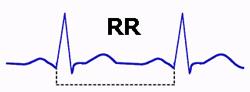
The R-R interval is the distance between two consecutive R waves. In sinus rhythm, this interval should be constant.
The duration of the R-R interval depends on the heart rate. It is measured from the beginning of an R wave to the beginning of the next one (see R-R interval calculator).
PR Interval
Related article: PR interval.
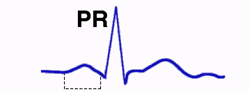
The PR interval represents the atrial depolarization and physiological delay of the stimulus in the atrioventricular (AV) node.
It is measured from the beginning of the P wave until the beginning of the Q or R wave. Its normal value is between 0.12 s and 0.20 s.
In cases such as pre-excitation syndromes, the PR interval may be shortened, it represents an accelerated AV conduction.
In cases such as first degree AV Block the PR interval is prolonged, representing delayed AV conduction.
More information: PR interval.
QRS Interval
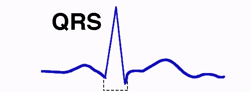
It measures the total time of ventricular depolarisation. It is measured from the beginning of the Q or R wave until the end of the S wave (or R’ if it is the last wave).
Its normal value ranges between 0.06 s and 0.10 s.
The QRS interval includes the set of waves composing the QRS complex; it is prolonged in bundle branch blocks and pre-excitation syndromes.
QT Interval
Related article: QT interval abnormalities
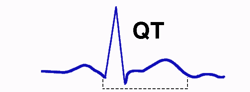
The QT interval represents the electrical ventricular systole, that is, the set of ventricular depolarisation and repolarisation.
Its value varies with the heart rate, so it is advisable to adjust its value to the hear rate.
This correction is done with Bazett’s formula (dividing the QT interval by the square root of the R-R interval).
You can find a corrected QT calculator in our calculations section.
The corrected QT interval is normal between 340 ms and 450 ms in young adults (460 ms in children under 15 and 470 ms in women).
More information: QT interval.
ST-Segment
Related article: ST-segment abnormalities
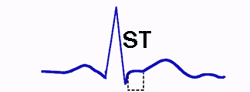
The ST-segment represents the beginning of ventricular repolarisation and it corresponds with the "plateau" phase of the action potential of ventricular myocytes.
Normally, it is isoelectric and it is measured from the end of the QRS complex and the beginning of the T wave (remember, unlike intervals, the ST-segment does not include any wave).
ST-segment abnormalities are of great importance for the diagnosis of acute coronary syndromes.