The U Wave
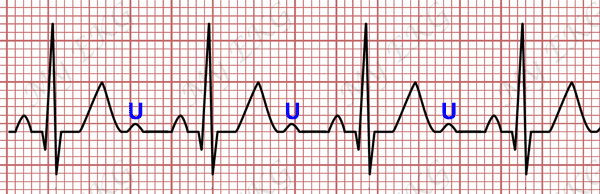
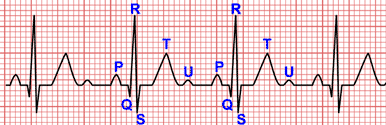
The U wave is the wave that begins with the second heart sound and after the T wave returns to the baseline or close to it.1
It is a low-amplitude and low-frequency deflection that occurs after the end of the T wave 2. It is usually monophasic and positive, and is best visible within a heart rate range of 50 to 100 bpm 3.
U wave is more evident in the leads V2 and V3, and is not usually recorded in the peripheral leads 2.
In leads V2 or V3, where the U wave is usually higher, its amplitude is approximately 0.33 mV or 11% of the T wave 2 4.
The presence of the U wave depends on the heart rate. It is rarely registered at heart rates above 95 bpm, while it is better observed at heart rates less than 65 bpm.
The U wave vector is directed similarly to the T wave vector. U wave is normally positive in precordial leads and is negative in lead aVR. U wave is usually isoelectric in leads I and aVL 1 4.
Major hypotheses for the origin of the U wave
There are three major theories for the origin of the U wave 1 3
- Repolarization of the His–Purkinje system.
- Repolarization of the papillary muscle or M cells.
- The mechanoelectrical hypothesis: afterpotential caused by stretching of the left ventricular wall during diastole.
Abnormalities of the U Wave
“AHA/ACCF/HRS Recommendations for the Standardization and Interpretation of the Electrocardiogram 2 suggest that the U wave should be included in the EKG interpretation when the U wave is inverted, when it is merged with the T wave, or when its amplitude is greater than that of the T wave” 2.
An abnormal U wave is a subtle finding and is rarely an isolated EKG abnormality 4.
Increased U Wave Amplitude
Several cardioactive drugs, such as thioridazine, amiodarone, dofetilide, digoxin, quinidine, or sotalol, may cause an increase in the amplitude of the U wave 4.
Serum potassium levels below 3 mmol/L (3 mEq/L) may also cause an increase in U wave amplitude in association with progressive depression of the ST-segment, and a decrease in T wave amplitude. With serum potassium levels below 2.7 mmol/L (2.7 mEq/L) the U wave amplitude may exceed the T wave amplitude in the same lead 4.
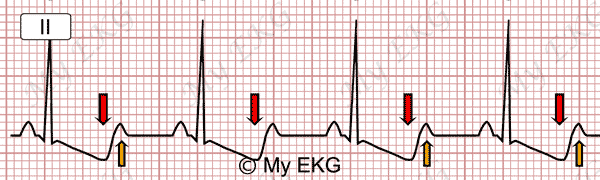
Severe hypokalemia:
Prominent U waves (orange arrows), ST-segment depression and negative T waves (red arrows).
During spontaneous or exercise-induced myocardial ischemia there is occasionally an increase in the amplitude of the U wave in the precordial leads. It is likely to be caused by a compensatory increase in movement of the non-ischaemic myocardial wall and by increased sympathetic stimulation 4.
Abnormal prominent U wave in anterior precordial leads without prolongation of the QT interval is a common finding in patients with Andersen-Tawil syndrome 5.
U Wave Inversion
During acute myocardial ischemia a transient inversion of the U wave may be observed.
This phenomenon is most common during exercise or coronary spasm, although it may also be observed during PTCA or during an acute coronary syndrome 4.
The presence of a negative U wave during exercise in the anterior precordial leads is both sensitive and specific for anterior wall myocardial ischemia, whereas a negative U wave in the inferior leads is specific but not sensitive for acute ischemia of the inferior wall 4.
Negative U waves may also appear transiently in the presence of elevated blood pressure 2 4.
T wave and U wave fusion
In the absence of T wave notching or QT interval prolongation, separation of the T wave from the U wave is not difficult to determine.
The fusion of the U wave and the T wave may occur in the presence of a markedly prolonged QT interval 2.
It may also occur with an increase in sympathetic tone 2.
In the same situations where there is an increase in the amplitude of the U wave, a fusion of the T wave with the U wave may occur 2.
When the T wave is notched, the distant T wave peak can be mistaken for U wave.
Fusion between T wave and U wave may also occur during atrial fibrillation or after a premature impulse 1.
References
- 1. Surawicz B. U wave: facts, hypotheses, misconceptions, and misnomers. J Cardiovasc Electrophysiol. 1998 Oct;9(10):1117-28. doi: 10.1111/j.1540-8167.1998.tb00890.x.
- 2. Rautaharju PM, Surawicz B, Gettes LS. AHA/ACCF/HRS Recommendations for the Standardization and Interpretation of the Electrocardiogram: Part IV: The ST Segment, T and U Waves, and the QT Interval. J Am Coll Cardiol. 2009;17;53(11):982-91. doi: 10.1016/j.jacc.2008.12.014.
- 3. Schimpf R, Antzelevitch C, Haghi D, et al. Electromechanical coupling in patients with the short QT syndrome: Further insights into the mechanoelectrical hypothesis of the U wave. Heart Rhythm. 2008;5(2):241–245. doi: 10.1016/j.hrthm.2007.10.015.
- 4. Surawicz B, Knilans TK. Chou’s electrocardiography in clinical practice, 6th ed. Philadelphia: Elservier; 2008.
- 5. Kukla P, Biernacka EK, Baranchuk B, et al. Electrocardiogram in Andersen-Tawil Syndrome. New Electrocardiographic Criteria for Diagnosis of Type-1 Andersen-Tawil Syndrome. Curr Cardiol Rev. 2014 Aug; 10(3): 222–228. doi: 10.2174/1573403X10666140514102528.
If you Like it... Share it.