Cardiac Cycle
The cardiac cycle is the sequence of electrical and mechanical events that are repeated with each heartbeat.
Each cardiac cycle begins with the generation of an electrical stimulus in the sinus node and the consequent contraction of the atria and ends with the relaxation of the ventricles.
The period of contraction, during which blood is pumped, is called systole and the period of relaxation, during which the chambers are filled with blood, is called diastole.
Atrial contraction
Stimulus generation in the sinus node causes atrial depolarization and contraction of both atria (a wave of the jugular venous pulse).
The cardiac cycle begins in the final phase of diastole with atrial contraction, which represents 20-30% of total ventricular filling.
Previously, during diastole, there has been a passive ejection of blood from the atria to the ventricles, allowing ventricular filling.
Systole
Isovolumetric ventricular contraction:
When the electrical stimulus is conducted from the AV node to the His-Purkinje system, ventricular depolarization occurs and contraction begins, increasing the pressure in the ventricles.
This situation causes the closure of the mitral and tricuspid valves, causing the first heart sound.
At this moment all valves are closed, there is no inflow or outflow of blood into the ventricles.
The pressure in the right ventricle causes the closed tricuspid valve to bulge towards the right atrium causing the c wave of the jugular venous pulse.
Subsequently, the pressure in the ventricles exceeds the pressure in the aorta and pulmonary arteries, opening the semilunar valves (aortic and pulmonary valves).
Rapid Ejection
When the semilunar valves open, there is a rapid ejection of blood from the ventricles into the arteries, with a consequent rapid fall in ventricular volume. It is at this moment that peak arterial flow occurs.
Reduced Ejection
Ventricular contraction decreases as blood ejection into arteries continues. At this moment calcium reuptake into the sarcoplasmic reticulum begins.
During systole the atria have been filling with blood, increasing in volume and pressure, which generates the v wave of the jugular venous pulse.
Ventricular Diastole
Isovolumetric relaxation
When the diastolic pressures of the aortic and pulmonary arteries exceed the pressures of the ventricles, the semilunar valves close, producing the second heart sound. This marks the beginning of diastole.
During this phase there is a rapid drop in ventricular pressure. All valves are closed in this period.
Rapid Ventricular Filling
When the ventricles relax, the pressures in the ventricles decrease and are lower than in the atria, resulting in the opening of the mitral and tricuspid valves.
When the atrioventricular valves open, there is a rapid and passive filling of the ventricles from the atria.
This initial rapid filling is mainly augmented by ventricular suction which results from ventricular untwisting and the return of each ventricular muscle fiber to its slack length.
Diastasis or Reduced Ventricular Filling
In this phase the pressures between the atria and ventricles are more equalized, which causes a slowing of ventricular filling.
During this phase the electrical stimulus is generated in the sinus node.
This phase continues with atrial contraction, starting a new cardiac cycle.
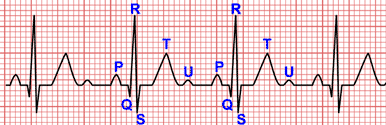
The Cardiac Cycle and the Electrocardiogram
The P wave appears during diastasis or slow ventricular filling. During the development of the P wave, atrial systole occurs, which includes the P wave and the PR segment.
The onset of the QRS complex occurs at the end of the atrial contraction and triggers contraction of the ventricles, shortly before the second heart sound.
The QT interval (QRS complex, ST-segment and T wave) represents ventricular electrical systole, i.e., the combined depolarization and repolarization of the ventricles. Electrical systole occurs slightly before ventricular systole.
The ST-segment represents the beginning of ventricular repolarization and corresponds to the slow plateau repolarization phase of the ventricular myocytes.
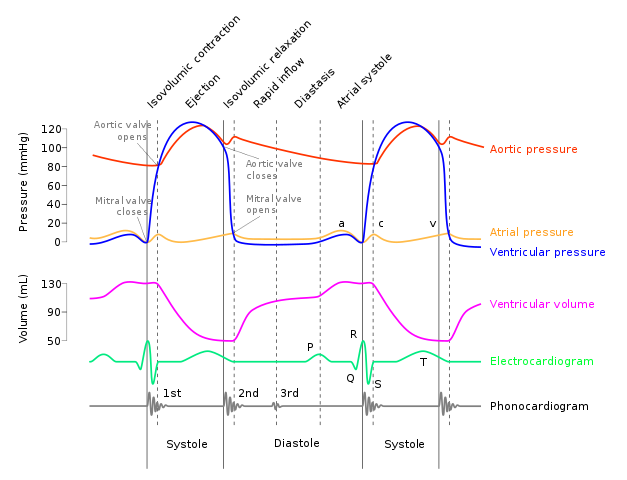
Wiggers Diagram:
Eventos del ciclo cardíaco que se observan en el ventrículo izquierdo.
Original image from Wikipedia.
T wave is the electrocardiographic representation of the repolarization of the ventricles, ending in the isovolumetric relaxation phase, just after the closure of the semilunar valves.
The rapid ventricular filling phase and a large part of the diastasis correspond to the TP interval.
At the end of the diastasis, electrical stimulation of the sinus node is generated, producing a new P wave, starting a new cardiac cycle.
References
- 1. Hall JE. Guyton and Hall Textbook of Medical Physiology. 13th ed. London: W B Saunders; 2015.
- 2. Surawicz B, Knilans TK. Chou’s electrocardiography in clinical practice. 6th ed. Philadelphia: Elservier; 2008.
If you Like it... Share it.