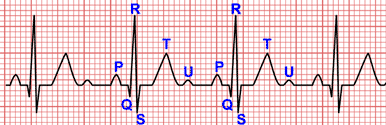
The Q Wave
The Q wave is the short initial downward stroke of the QRS complex formed during the beginning of ventricular depolarization 1.
Normal Q wave
Normal Q Wave in Limb Leads
In limb leads, the Q wave is present in one or more of the inferior leads (leads II, III, aVF) in more than 50% of normal adults and in leads I and aVL in about 50% 2.
The duration of the Q wave is of considerable importance in the diagnosis of myocardial infarction. With the exception of leads III and aVR, the Q waves in the limb leads normally do not exceed 0.03 s in duration (a little more than half a small square) 2.
The depth of the Q wave is less than 25% of the following R wave or less than 0.4 mV (4 small squares) in all limb leads, but lead III is the exception 2.
In lead III, Q wave duration is occasionally as long as 0.04 s but rarely is it 0.05 s. This lead accounts for most of the erroneous diagnoses of myocardial infarction 2.
In leads III, aVF, and aVL the initial R wave may be absent, and a QS or QR deflection may represent a normal variant 2 3.
The QS pattern in lead III is more prevalent in obese and the QS pattern is more prevalent in lead aVL in slender subjects 2.
In lead aVR the Q wave is usually is part of the QS morphology.
Normal Q Wave in Precordial Leads
Small Q waves may be present in left precordial leads in more than 75 percent of normal subjects 2.
They are seen most frequently in lead V6, less frequently in leads V5 and V4, and rarely in V3.
Q waves in these leads are present more often in young subjects than in subjects older than 40 years.
The duration of the Q waves is 0.03 s or less. The amplitude usually is less than 0.2 mV, although it may reach 0.4 mV (4 small squares) 2.
An amplitude of 0.4 mV or more may be encountered in teenagers.
In the posterior leads V7–V9, Q wave duration of 0.03 s may be observed in 20% of normal male subjects 2.
Abnormal Q Wave
On the electrocardiogram, an abnormal Q wave is usually defined in adults as one that has a duration of 0.04 s (a small square) or more 2.
Some authors consider the amplitude of the Q wave a criterion of abnormality, when the amplitude of the Q wave exceeds 25% of the following R wave. Such a finding, however, has low specificity and should not be used as a reliable marker of myocardial infarction in practice 2.
The definition of a wide Q wave does not apply to leads aVR and V1, which may normally lack the initial R wave.
A Q wave is also considered abnormal, even if it is less than 30 ms in duration, when it is present in leads that normally display an initial R wave (leads V2 and V3) 2.
Myocardial Infarction with Abnormal Q Wave
During an acute myocardial infarction, the development of new Q waves indicates myocardial necrosis, which starts 6 to 14 hours after the onset of symptoms 2 4.
Most commonly the Q waves develop while the ST-segment is still elevated and persist for a variable number of days, weeks, months, or years and often indefinitely 2.
When the abnormal Q waves are associated with ST-segment deviations or T wave changes in the same leads, the likelihood of myocardial infarction is increased 4.
In the present era of thrombolytic therapy and primary angioplasty for STEMI, the reversal of abnormal Q waves occurs more frequently.
Transient Q waves may be observed during an episode of acute ischemia or (rarely) during acute myocardial infarction with successful reperfusion.
In asymptomatic patients, the presence of abnormal Q waves on an electrocardiogram indicates a high probability of ischemic heart disease 4.
The development of Q waves during STEMI increases the prognostic risk 4.
The presence of Q waves on the EKG should not necessarily change the reperfusion strategy decision 5.
Other causes of Q waves
Improper leads placement, QRS complex abnormalities, or technical errors (e.g. lead reversal) may result in the appearance of new Q waves or QS complexes, as compared with a prior tracing 4.
In infants and children with an an anomalous left main coronary artery originating from the pulmonary artery, abnormal Q waves with a duration greater than 0.03 s may be observed in leads I and aVL in most cases 2.
Q waves may also occur in cardiomyopathies due to myocardial fibrosis in the absence of ischemic heart disease 2.
New Q waves similar in morphology to those observed in acute myocardial infarction are also common after acute stroke, reported in approximately 10 percent of patients with acute ischemic or hemorrhagic stroke 6.
References
- 1. “Q wave.” Merriam-Webster.com Medical Dictionary. Merriam-Webster. Accessed 11 Aug. 2021. Available from: merriam-webster.com/medical/Q%20wave.
- 2. Surawicz B, Knilans TK. Chou’s electrocardiography in clinical practice, 6th ed. Philadelphia: Elservier; 2008.
- 3. Collet JP, Thiele H et al. 2020 ESC Guidelines for the management of acute coronary syndromes in patients presenting without persistent ST-segment elevation: The Task Force for the management of acute coronary syndromes in patients presenting without persistent ST-segment elevation of the European Society of Cardiology (ESC). Eur Heart J. 2020; 00: 1–79. doi: 10.1093/eurheartj/ehaa575.
- 4. Thygesen K, Alpert JS, Jaffe AS et al. Fourth universal definition of myocardial infarction (2018). Eur Heart J. 2019; 40 (3): 237–269. doi: 10.1093/eurheartj/ehy462.
- 5. Ibanez B, James S, Agewall S, et al. 2017 ESC Guidelines for the Management of Acute Myocardial Infarction in Patients Presenting With ST-Segment Elevation: The Task Force for the Management of Acute Myocardial Infarction in Patients Presenting With ST-Segment Elevation of the European Society of Cardiology (ESC). Eur Heart J 2017; Aug 26. doi 10.1093/eurheartj/ehx393.
- 6. Ko NU. Cardiac Manifestations of Acute Neurologic Lesions. In: Aminoff MJ, S.Andrew Josephson SA. Aminoff's Neurology and General Medicine. 5th. ed. Academic Press; 2014. 10.1016/C2012-0-03031-1.
If you Like it... Share it.